
HR Analytics Using Power BI
Created a comprehensive Power BI dashboard analyzing employee attrition and workforce trends. Delivered actionable insights that helped HR teams improve retention strategies and optimize compensation structures.
Delivering Insights with Clarity, Simplicity & Impact
I help businesses unlock the full value of their data by building clean, insightful dashboards and automating reporting processes. With expertise in Power BI, Excel, Python, and SQL, I turn raw data into accurate, meaningful visual stories that drive smart decisions.
I also integrate AI tools like GPT to streamline analysis and boost efficiency. I believe clear visualizations speak louder than words — so every project I build focuses on clarity, simplicity, and real business value.
Feel free to connect with me on LinkedIn to discuss collaborations or opportunities.
I’m an AI-driven aspiring data analyst with a passion for uncovering insights and telling stories 
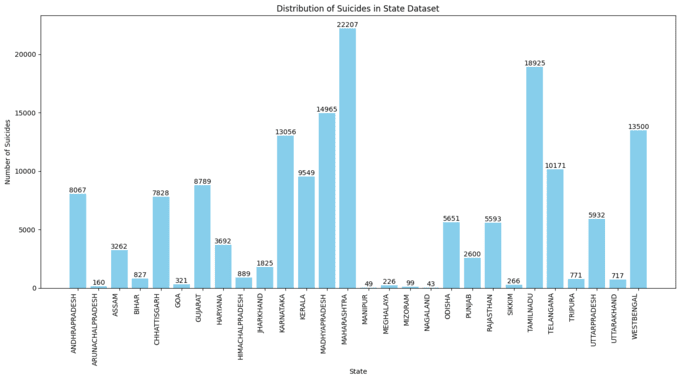
through data. My journey began during my MCA when I worked on a project analyzing suicide trends in India — that experience opened my eyes to the power of data in creating real impact.
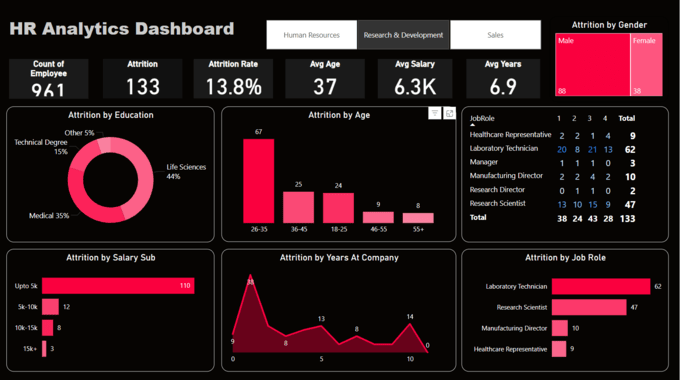
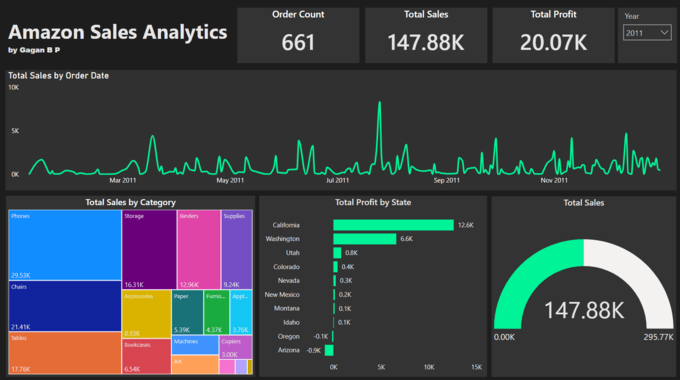
Since then, I’ve been honing my skills in Power BI, Excel, Python, SQL, and data visualization to clean, explore, and present data in meaningful ways. I enjoy building dashboards that don’t just look good but deliver clarity, simplify decisions, and communicate patterns that matter.
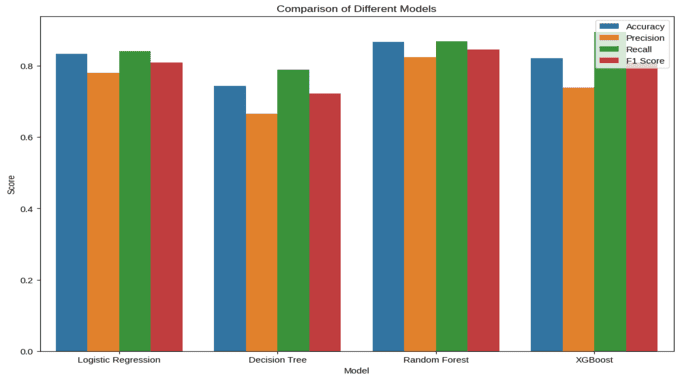
I actively use AI tools like ChatGPT to streamline workflows and boost productivity. Whether it’s data cleaning, reporting automation, or turning raw data into strategic insights — I focus on reducing noise and helping businesses and teams make informed, confident decisions.
Always learning, always improving — I’m committed to growing into a data analyst who brings not just technical skill, but real business value.
Created a comprehensive Power BI dashboard analyzing employee attrition and workforce trends. Delivered actionable insights that helped HR teams improve retention strategies and optimize compensation structures.
Developed an interactive Power BI dashboard analyzing Amazon sales trends, product performance, and state-wise profits. Enabled data-driven decision making through comprehensive sales analytics and regional performance insights.
Compared multiple machine learning, deep learning, and ensemble models for heart disease prediction. Achieved 93% ROC-AUC with a stacked ensemble model, demonstrating strong evaluation and model optimization skills.
Analyzed suicide trends across Indian states using NCRB 2021 data. Created comprehensive visualizations to understand patterns and contributing factors, providing insights for public health policy decisions.
Analyzed Netflix movie dataset to explore trends in popularity, genres, ratings, and release years. Performed data cleaning, visualization, and statistical analysis to uncover key insights about factors influencing movie success on the platform.
I create professional Excel dashboards using advanced formulas, pivot tables, conditional formatting, charts, and slicers. Ideal for tracking KPIs, business metrics, or custom reports based on your data.
I design interactive and visually compelling reports in Power BI using DAX and Power Query. Whether you need dashboards for sales, operations, or data monitoring, I can help you present your data effectively.
I clean messy or unstructured data using Excel functions, Power Query, or Python (Pandas). From handling missing values to formatting columns, I ensure your data is clean, consistent, and ready for analysis.
I write optimized SQL queries in MySQL for selecting, filtering, joining, and summarizing data. Whether it's simple reports or complex conditions, I can help you extract the right insights from your database.
I use Matplotlib and Seaborn to create clear and impactful charts like bar graphs, heatmaps, line plots, and more. These visuals help you explore and present your data effectively in reports or dashboards.
I build beginner-friendly machine learning models using scikit-learn. I can help you with data preparation, model training, accuracy evaluation, and visual insights — great for academic or prototype-level use.
I automate Excel tasks like updating files, formatting data, or generating reports using Python scripts and AI (GPT). Save time by letting me handle repetitive Excel work with smart automation.
I build simple, clean personal websites using HTML and CSS — ideal for portfolios, resumes, or freelancer profiles. I can also help you host it on GitHub Pages for free access online.
Ready to transform your data into insights? Let's discuss your project and how I can help you achieve your goals.
212, 5th cross, Vyalikaval HBCS Layout, Nagavara
Bengaluru, Karnataka 560045
Relevant Coursework: Data Analysis in Python, Internet of Things (IoT), Database Management Systems (DBMS), Data Structures and Algorithms
Relevant Coursework: Python, Internet of Things (IoT), Database Management Systems (DBMS), Data Mining